Shifting stock-bond returns correlations and why it matters for your portfolio
Shifting stock-bond returns correlations
Over the past three decades, the correlation between equity prices and government bond yields has fluctuated, tending to be negative. However, this was not the case for much of the last century, and depending on the macroeconomic context - high or low inflation or high or low economic growth - we could see a return to the positive stock-bond correlation of the 1970s, 80s and 90s. Indeed, the traditional 60/40 portfolio (60% equities and 40% bonds) fell 18.5% in 2022, one of the biggest declines in decades, with both stocks and bonds showing negative returns.
We examine the behaviour of the stock-bond correlation in the past decades, exploring the key macroeconomic determinants of the stock-bond correlation and venture a forecast of where we think it will be in the coming years.
The evolution of the Stock-Bond correlation in the US
In the charts below, we present three variables: (i) the correlation between the returns of the US 10-year bond and the S&P500, (ii) the return of a portfolio composed by 60% equity and 40% bonds and (iii) the annual consumer inflation rate.
The chart shows that the stock-bond correlation was positive for a large part of the 20th century, specifically 1940-1952 and 1965-2000; it also shows that the return of the 60/40 portfolio was more volatile during periods of positive correlation than during periods of negative stock-bond correlation. Finally, the chart shows that periods of high and volatile inflation coincide with a positive stock-bond correlation and periods of low and stable inflation, such as 1952-1965 and 2000-2020, coincide with a negative stock-bond correlation.
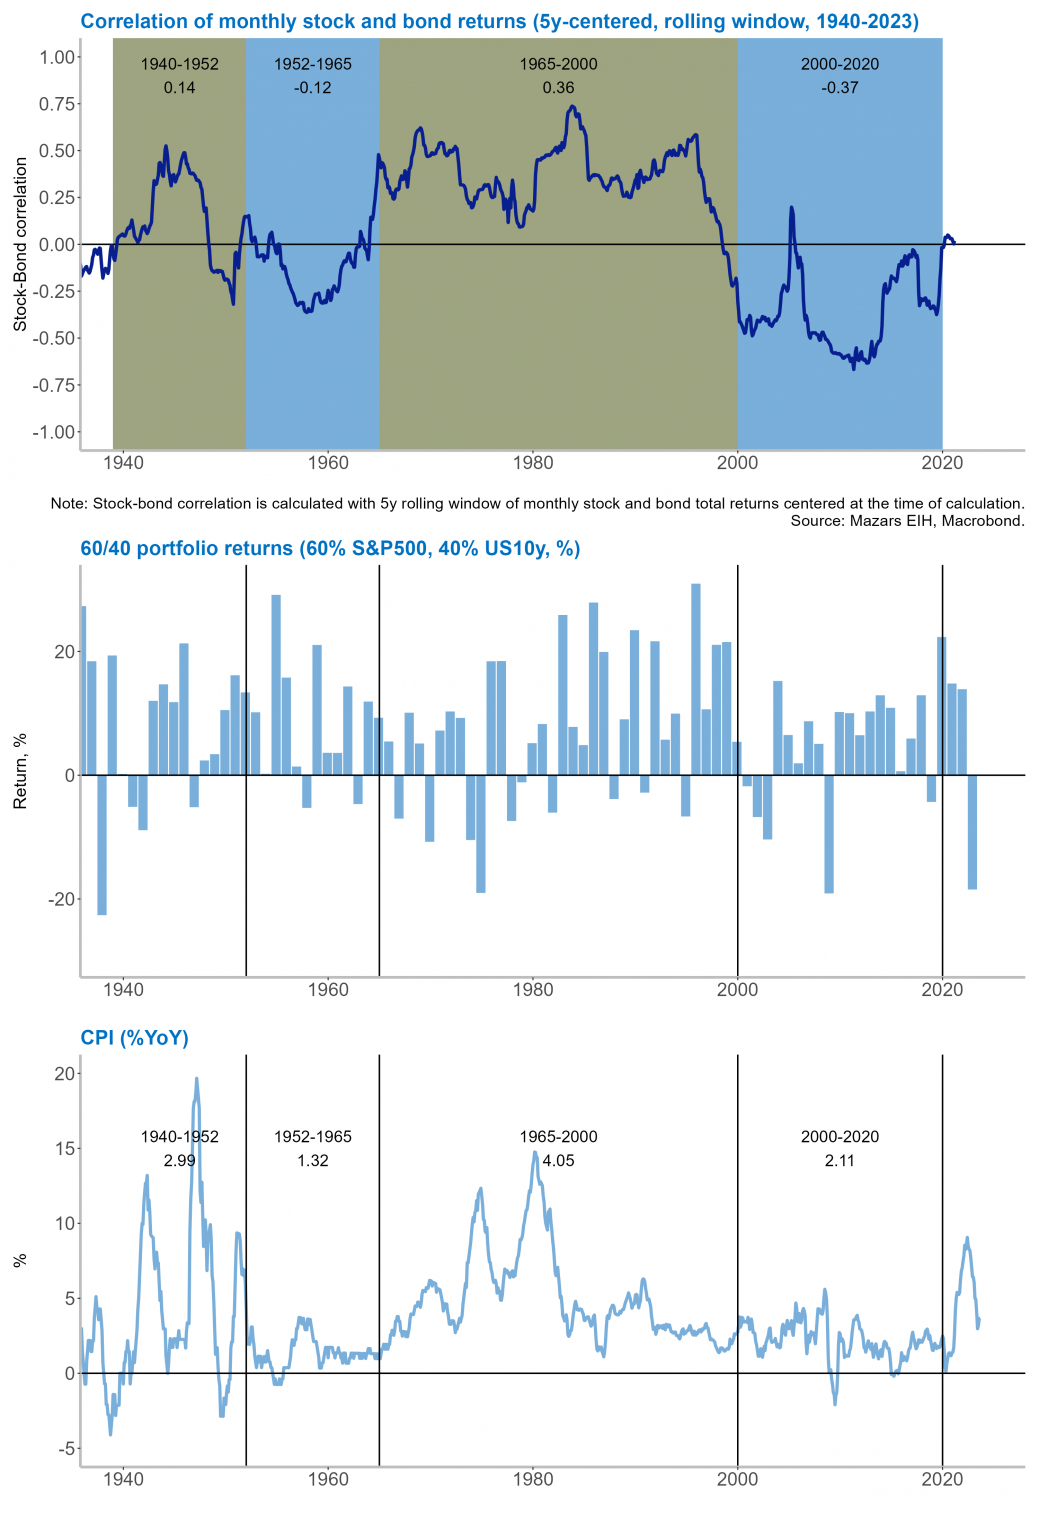
Source: Mazars EIH, Macrobond.
The academic literature on the Macroeconomic determinants of stock-bond correlations is very much in line with what the chart shows. Most papers find that periods of positive stock-bond return correlation coincide with high inflation expectations, high inflation volatility and high interest rate and growth volatility, while periods of negative stock-bond return correlation coincide with low inflation and low interest rate and growth volatility.
What to expect for the stock-bond return correlation in the near future?
The period of negative correlations observed in the US between 2000 and 2020 is a historical outlier. It was the longest period of negative correlation ever recorded for any country ever. Most macro trends point to a higher and more volatile inflation environment in the coming years: labour shortages, demographics, the green transition, and the reshoring of supply chains. This should lead to a positive or at least low negative correlation between equity and bond returns.
It is crucial for portfolio managers to take this into account when implementing hedging strategies, as it could mean that the 60/40 portfolio, long revered as a reliable guide for the moderate-risk investor, may already be obsolete for this decade's portfolios.
Santiago Rossi, Senior Economist