Want to know more?

Life expectancy improvements are continuing to slow in the UK and whilst there is much ongoing debate around the likely causes, there is a growing consensus that this trend is here to stay.
This article explores the necessary modifications to mortality projections and considers how actuaries
and the wider insurance and pensions sectors should be reflecting these projections into their valuations.
Considering the newest available data on England & Wales mortality from the Office of National Statistics (ONS) for the year of 2018, it becomes apparent that the previously observed slowdown in general population mortality improvements since 2011 has continued into 2018. As mortality rates vary by age and the age-profile of the population changes over time, for actuarial purposes it is useful to consider SMRs (standardised mortality rates) as a measure of how mortality rates are changing across a range of ages.
Graph 1 shows the decrease of the SMRs over time for both males and females as well as the combined view. The Graph is based on the age range 40 to 84. The trend lines plotted from 1999 to 2010 and from 2011 to 2018 show the drastic and very pronounced change in trend in 2011. Since 2011 mortality has continued to improve albeit at a much lower rate.
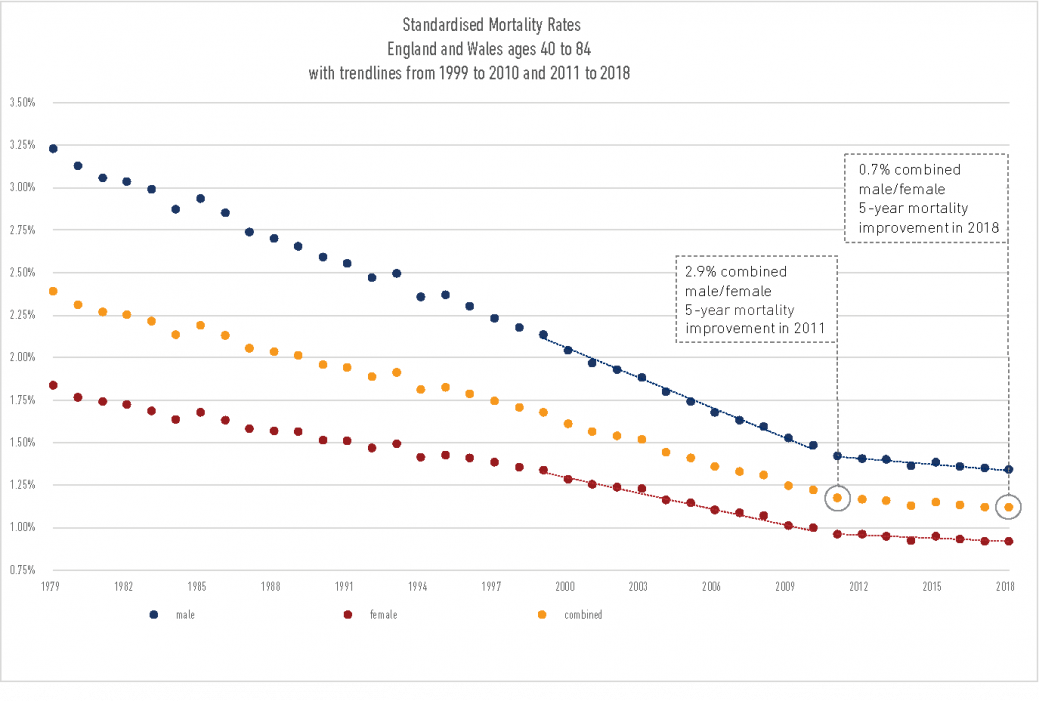
The data shows, and this is also apparent visually based on Graph 1, that male and female mortality rates have converged over time in both absolute and relative terms. Annual mortality has some volatility and with a focus on recent years since 2011, Graph 1 shows the mortality was low in 2014, higher again in 2015 mostly due to an influenza outbreak early that year and has dropped in 2017 and 2018 to levels comparable to 2014. The one-year mortality improvement between 2017 and 2018 has been close to zero.
Due to short-term influences such as winter temperatures and for instance the aforementioned prevalence of influenza, year on year mortality improvements are volatile. In order to reveal longer-term patterns more clearly, it is useful to consider mortality improvements averaged over five years for example. Based on the data underlying Graph 1, the five-year mortality improvement for males and females combined was 2.9% in 2011 and only 0.7% in 2018.
The essence of Graph 1 would be the same, even if we were to consider all ages. It is also interesting to note that the slowdown in general population mortality improvements since 2011 can be observed not only in the UK but in a number of advanced countries such as the US and Germany.
The UK mortality improvements slowdown since 2011 is well publicised, however, the driving factors are not fully understood. There are a number of theories ranging from ineffective treatments for infectious diseases, such as the influenza, to economic and political factors, such as a lack of spending on health and social care, as well as theories based on lifestyle factors. Whilst it may be the end of the process of reducing the number of people who smoke,
obesity is still a continued concern and stress related illnesses may be on the rise.
According to the ONS “Mortality rates for cancers, respiratory diseases and circulatory diseases have decreased. However, rates increased for mental and behavioural disorders, such as dementia, and diseases of the nervous system, such as Parkinson’s and Alzheimer’s. This could be partly linked to a better understanding of these conditions, which may have led to better identification and diagnoses.”
Whilst there is considerable debate amongst medical professionals and actuaries about the causes, there seems to be a general consensus and increasing evidence based on the latest data that the low levels of recent mortality improvements are due to medium- or long-term influences rather than short-term effects, ie. that the slowdown will persist in the near future.
Regardless of what the causes are, it is important to allow for the trend in projections of mortality improvements in actuarial valuations. The CMI (Continuous Mortality Investigation) is wholly owned by the Institute and Faculty of Actuaries and provides authoritative and independent mortality tables for actuaries advising UK life insurers and pension funds.
A key area of the CMI is to consider future changes in mortality experience, including the development and production of the CMI Model. The purpose of the CMI Model is to allow users to produce projections of annual rates of mortality improvement. Specifically, the Model allows users the flexibility to modify projections tailored to their own views and purpose.
The latest “CMI_2018” Model released on 7 March 2019 is even more advanced than the previous year’s version and allows further parameterisation to better adjust future projections for recent observed trends.
For actuarial modelling of life expectancy, two parts need to be considered – firstly the current mortality rates for the portfolio under consideration and secondly a projection of how these mortality rates are expected to change in the future. The CMI_2018 Model focuses on the latter part. It is a model of mortality improvements, ie. reductions in mortality rates from year to year.
The CMI_2018 Model smooths historical mortality rates to reduce the effect of volatility and produces estimates of current mortality improvements by age and gender, which are derived from historical data. It also blends between current and long-term future mortality improvements. The latter assumption needs to be set by the user of the Model.
As the fall in general population mortality improvements in the UK since 2011 has been greater than predicted by most projection models, the question for the CMI was how this observation could be reflected in future projections generated by the CMI_2018 Model. As a result of this, two key changes have been introduced with the CMI_2018 Model, both of which have a material impact:
Besides these two key changes, the latest model is of course calibrated to the most up to date England & Wales population mortality data up to 31 December 2018 and one further methodological change has been introduced regarding how populations at high ages are estimated, however neither of those have a material impact compared to the two key changes.
The CMI_2018 Model essentially uses historical data including most recent experience to estimate current rates and then interpolates between current rates and assumptions of longterm rates to project rates of mortality improvement. This process is carried out separately for age-period and cohort components, and these are summed to give the overall mortality improvements.
The ‘period smoothing parameter’, SK, controls how much emphasis the Model places on the most recent experience. A lower value applies less smoothing and hence places more weight on recent experience. With the recent trend showing low mortality improvement and with the reduction of the core value of the period smoothing parameter SK, the standard settings of the Model lead to lower estimates of current mortality improvements as the projected age-period component
of the initial mortality improvements is reduced. Overall this leads to lower initial mortality improvements and lower life expectancies.
This second new parameter also adjusts the age-period component of initial mortality improvements. The standard value is 0%. If this was for example set to 1% then the mortality improvement for the age-period component would be 1% better in the current year for ages up to 85 and taper down to 0% for older ages and also over the initial years. The example of 1% would hence lead to a higher life expectancy overall.
This parameter allows further fine tuning, which is particularly useful when considering specific populations other than the general UK population based on England & Wales data, which was used to calibrate the Model.
Considering the CMI_2018 Model with its new features and comparing this to older versions as well as considering what next year’s Model could look like helps those contemplating using the latest Model. The cohort life expectancy resulting from the CMI_2018 Model is lower than in all previous versions of the CMI Model. This is based on using the core model parameters from the CMI_2018 model analogous for older versions.
For a male age 65 for example the cohort life expectancy based on the CMI_2018 is around six months lower than in the CMI_2017 Model and around 13 months lower than in the CMI_2015 Model. Cohort life expectancy is of course based on unknown future changes of mortality and is therefore a subjective measure that depends on assumed future changes in mortality. Assuming mortality improvements in 2019 are in line with the CMI_2018 core Model projections, then life expectancies are expected to be lower in CMI_2019 than in CMI_2018.
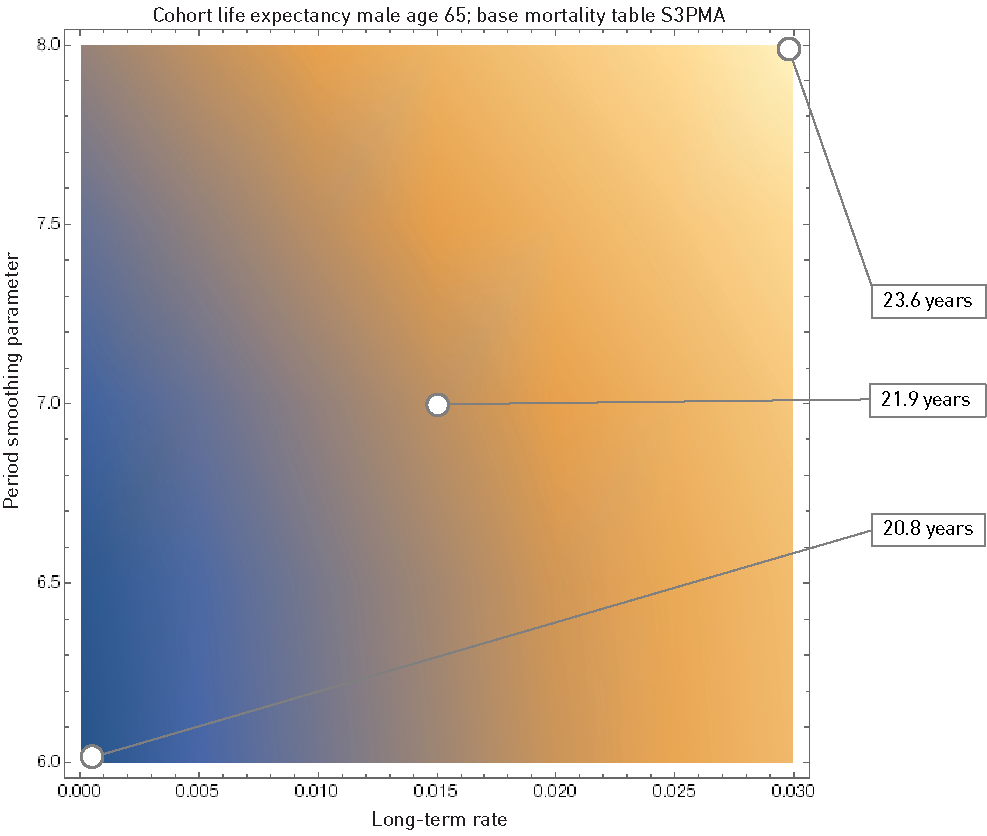
Graph 2 above shows how sensitive the CMI_2018 Model is based on varying the period smoothing parameter and the long-term rate. The cohort life expectancy for a male age 65 based on the mortality table S3PMA for example spans a range from 20.8 years to 23.6 years. Whilst the long-term rate has a relatively linear effect, Graph 2 clearly shows the smoothing effect.
Users of the Model have more flexibility yet the responsibility to use appropriate parameters for the individual circumstances.
Many UK insurance companies and pension schemes use the CMI Model either to set their assumptions of how mortality rates will change in future or to validate and communicate assumptions they have set by other means.
As Tim Gordon, Chair of the Mortality Projections Committee, has put it, the new Model “CMI_2018 reflects increasing evidence that the lower level of improvements may be due to medium or long-term influences, rather than just short-term volatility”. The Model however allows much more flexibility beyond this with the core, extended and advanced functionality. Users simply need to be aware of how to best use the Model and run sensitivities for their specific purpose.
One example is that further analysis based on the IMD (Index of Multiple Deprivation) has shown that for a lower IMD, ie. those of a higher socioeconomic status, the mortality is lower and the recent mortality improvements have been higher than for those of more deprived groups. The portfolios of life insurance companies or pension schemes are generally expected to be in line with a lower IMD and hence this needs to inherently be reflected in the Model parameterisation.
As there is still uncertainty about the causes of recent mortality, and hence uncertainty about the appropriate level of initial mortality improvements, users should consider several choices for each of the parameters, including the new ones, and compare this to the results from the previous Model they used.
Life insurance companies are likely to be interested in how the CMI_2018 Model compares with the previous year’s version. Pension scheme trustees are more likely to be interested in how the CMI_2018 Model compares with the one three year’s prior due to triennial valuations. Actuaries will have to consider the impact on actuarial valuations. The mortality improvements in the years prior to 2011 triggered material increases in future life expectancy assumptions used in actuarial valuations. This increased the value of pension liabilities for example. The recent experience from 2011 until 2018 will now partly unwind these increases.
This article is co-authored by Lionel Cazali and Verena Bek.

Our Actuarial team has expertise in using financial, risk, and capital modelling to help clients manage the complexities that are inherent in business. We use a blend of technical and commercial expertise to provide insight, assurance and enable effective decision-making by business leaders.
This website uses cookies.
Some of these cookies are necessary, while others help us analyse our traffic, serve advertising and deliver customised experiences for you.
For more information on the cookies we use, please refer to our Privacy Policy.
This website cannot function properly without these cookies.
Analytical cookies help us enhance our website by collecting information on its usage.
We use marketing cookies to increase the relevancy of our advertising campaigns.