The economy & your investments
Join our Chief Economist and Chief Investment Officer as they discuss the global economy, inflation, interest rates, and the investment landscape.
What the yield curve is telling us right now
The US treasury bond is widely used as the benchmark for a “risk-free asset”. This means that, if the US 10-year treasury bond has a yield of 4.6%, then markets believe this is the return that can be achieved on a 10-year horizon with (theoretically) zero risk. Treasury yields therefore tell us what markets expect for the US economy at different time horizons. If you plot a chart of yields against maturity lengths, this gives rise to a yield curve.
In a normal market, there is a positive term premium, meaning that longer-term bonds should yield more than shorter-term bonds. This is intuitive since the longer you hold a bond, the more chance there is that high inflation or interest rates will erode your return.
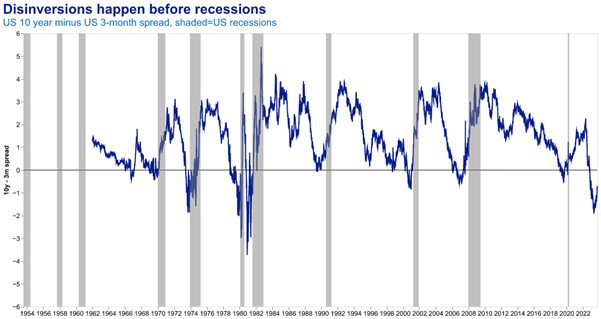
But we are not in a normal market. Currently, the yield on 3-month Treasury bills is around 70 basis points higher than the yield on 10-year Treasury bonds. This is what is known as an inverted yield curve. Historically, an inverted 10-year — 3-month yield curve has been a good predictor of US recessions.
Eight of the last US recessions have been preceded by an inversion of the 3-month — 10-year yield spread. Several explanations have been put forward for this phenomenon. One is that an inverted yield makes it harder for banks, which borrow money on the short end of the curve (deposits) and lend on the long end (mortgages) to make profits. Another is that the yield curve represents the market’s belief that short-term growth will be much worse than long-term growth.
What this inverted curve means for markets has been one of the most contentious debates of the last few months. There are concerns that quantitative tightening by the Fed has muddied the picture, or that the inversion of the yield curve will itself influence behaviour – causing companies to mitigate risk by saving cash and avoiding investment.
But it is too soon to tell for sure. For now, we remain within the long and variable lags for recession indicators – about 12-24 months. It is very easy to cast doubt on a prediction of an event a year ahead. But the fact remains, that the yield curve is the recession predictor which has been more accurate than any other in the past, having the least false positives and false negatives (remember that a goldfish which always predicts “no recession” will be right 95% of the time – many economists do no better).
The 2000 and 2008 recessions were preceded by surges in “soft landing” calls in news articles. The same has happened this year, even though recessions have taken longer to materialize following an inversion in a majority of historical cases.
Year of 10y-3m Inversion | Months to recession |
1966 | 20 |
1968 | 12 |
1973 | 7 |
1978 | 16 |
1989 | 15 |
2000 | 13 |
2006 | 24 |
2022 | 11 (so far) |
The inverted yield curve is not new. What’s new is that the curve has started to dis-invert. Dis-inversions might be viewed as an even stronger sign of an oncoming recession, as previous recessions have generally occurred after a full dis-inversion.
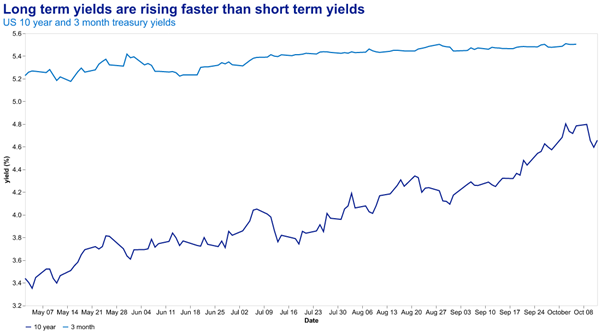
And it is not only the fact of the dis-inversion but how it is proceeding. Since the low point of the 10-year — 3-month spread in May of this year, 10-year yields have risen by 1.30% while 3-month yields have risen by only 0.25%. A narrowing of the spread which happens due to the long end of the curve moving up is known as a ‘bear steepener’. This has happened due to the Federal Reserve signalling that it will keep rates “higher for longer” while keeping policy rates (which are more closely tracked by shorter-term treasuries) stable. Issuance by the US Treasury, quantitative tightening, and recent geopolitical events have also served to support the rise in longer-term yields.
A bear steepening of an inverted yield curve can put pressure on non-financial firms as well. As pointed out by Gavekal analyst Tan Kai Xian, the interest expense of US firms depends more on the yield curve and less on outright interest rate levels. A bear steepener means that firms will pay more interest on long-term debt, while cash returns will be diminished, leading to lower profits. If a recession is indeed imminent, our bear steepener will likely turn into a bull steepener, where both long-term and short-term yields fall, but short-term yields fall further as the Fed cuts rates.
In a bull steepener, investors should want to be positioned in longer-term bonds, which experience more of a price increase per unit drop in yield (bond prices and yields move in opposite directions).
However, long-term investors understand that timing the market is like catching a falling knife. Based on history, a recession and bull steepener may still be up to 12 months away. The cost of making a call too early can be as great as the reward for getting the time just right. Geopolitics, quantitative tightening, and inflation could yet keep long-term yields high. On balance, waiting for more information is likely prudent, even if at the cost of missing the start of a potential rally.
Tao Yu, Quantitative Analyst
Join our Chief Economist and Chief Investment Officer as they discuss the global economy, inflation, interest rates, and the investment landscape.

Read our latest news and analysis on the changing markets and economic environment.

“What if I could tailor my investments to my needs?”
This website uses cookies.
Some of these cookies are necessary, while others help us analyse our traffic, serve advertising and deliver customised experiences for you.
For more information on the cookies we use, please refer to our Privacy Policy.
This website cannot function properly without these cookies.
Analytical cookies help us enhance our website by collecting information on its usage.
We use marketing cookies to increase the relevancy of our advertising campaigns.