It provides a range of liquidity metrics under stressed and unstressed market conditions, allows for benchmarking of a fund against its peers, and displays analysis in a visually intuitive manner.
We understand that each fund has unique needs, and our platform ensures complete customisation to meet the user’s specific liquidity analysis goals. It is designed to adhere to regulatory guidelines such as COLL rules and IOSCO recommendations while incorporating industry best practices.
Below is an overview of what our platform is capable of:
Identification of Comparable Funds: Our model identifies comparable funds based on a common benchmark index using the EIKON module from Reuters. This ensures a relevant and meaningful comparison that aligns with the user’s fund's investment focus.
Monthly Composition of the fund and Securities Data Download: Our model retrieves monthly compositions and relevant securities data, including Daily Trading Volume (DTV) and price information, for the identified comparable funds. This comprehensive dataset forms the foundation for our analysis.
Data Cleaning and Quality Assurance: Our model performs rigorous data cleaning processes to ensure accuracy and reliability. Missing data points and inconsistencies are addressed, and feedback is provided to EIKON to improve data quality where necessary.
Generation of Key Liquidity Metrics: Our model generates essential liquidity metrics for all funds, including bucket allocation, the percentage of fund Net Asset Value (NAV) liquidable within a specific number of days, and the number of days required to liquidate a certain percentage of the fund. These metrics offer a comprehensive view of liquidity dynamics.
Meaningful Visualization of Results: Our model presents results in a visually intuitive manner, allowing the user to compare their fund's metrics against key statistics. The user can easily assess their fund's performance relative to the median of funds, identify the best and worst performers for each metric, and analyse key percentiles.
Our platform consists of three main modules, which are described in more detail below:
- Liquidity metrics
- Stressed liquidity metrics
- Benchmarked liquidity metrics
Liquidity Metrics
Our platform offers a diverse range of liquidity metrics tailored to meet the specific needs of each fund. These metrics provide valuable insights into liquidity dynamics and enable effective decision-making. We understand that each fund has unique needs, and our platform ensures complete customisation to meet user-specific liquidity analysis goals.
We present below an overview of the main liquidity metrics reported.
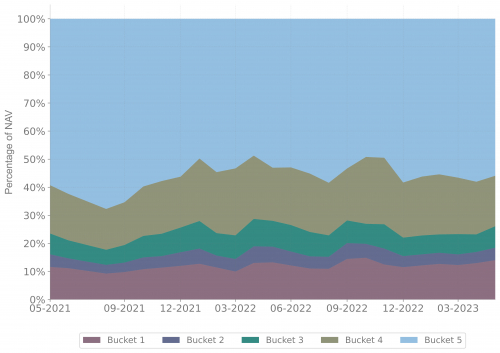
Bucketing of assets: Classification of securities into liquidity buckets based on participation rate and average daily traded volume (ADTV).
Our tool divides the fund into liquidity buckets. The allocation of shares to each bucket is based on their anticipated time to liquidation. The size and number of buckets can be tailored according to the fund liquidity metrics specifications (participation rate, length for averaging of volumes, etc.) ensuring flexibility and adaptability. Our tool offers detailed information on how the buckets have evolved through time, providing the user with valuable insights into the overall liquidity dynamics. Triggers and limits can be added for each bucket. These guidelines have been developed by considering current industry standards and best practices, ensuring a robust liquidity management approach.
Figure 1: Liquidity buckets over time with a 15% participation rate and ADTV calculated using a 6-month rolling average.
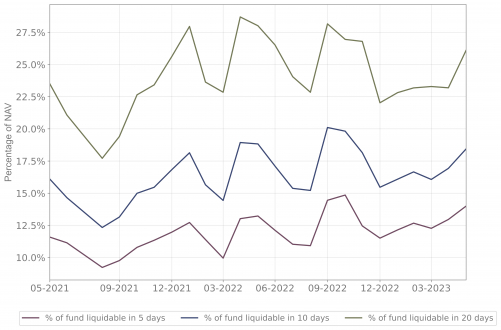
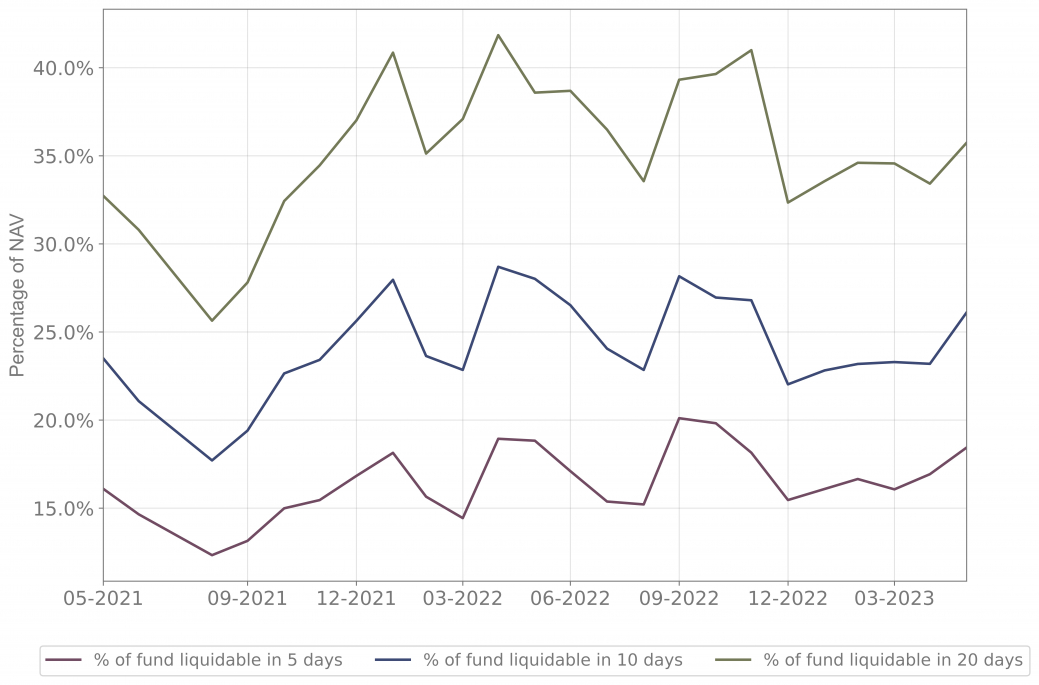
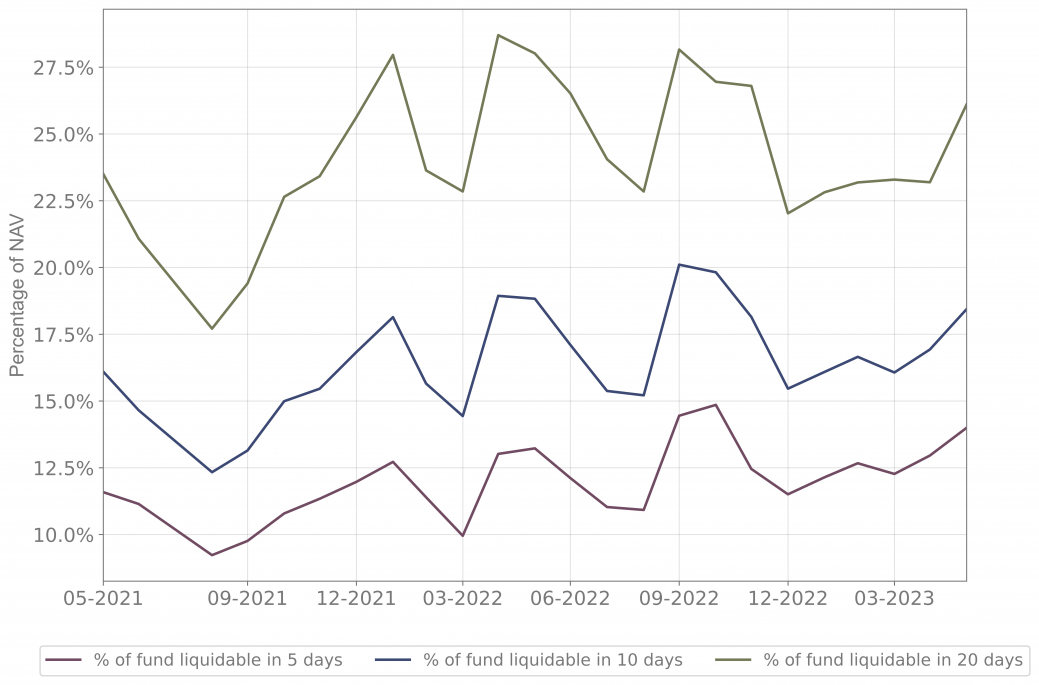
Percentage of NAV liquidable within different time horizons - Liq(N): % of fund Net Asset Value (NAV) liquidable within a certain period of time expressed as a number of business days based on specific assumptions of participation rate and ADTV.
Figure 2: Unstressed TLiq(x%) metric over time with a 15% participation rate and ADTV calculated using a 6-month rolling average.
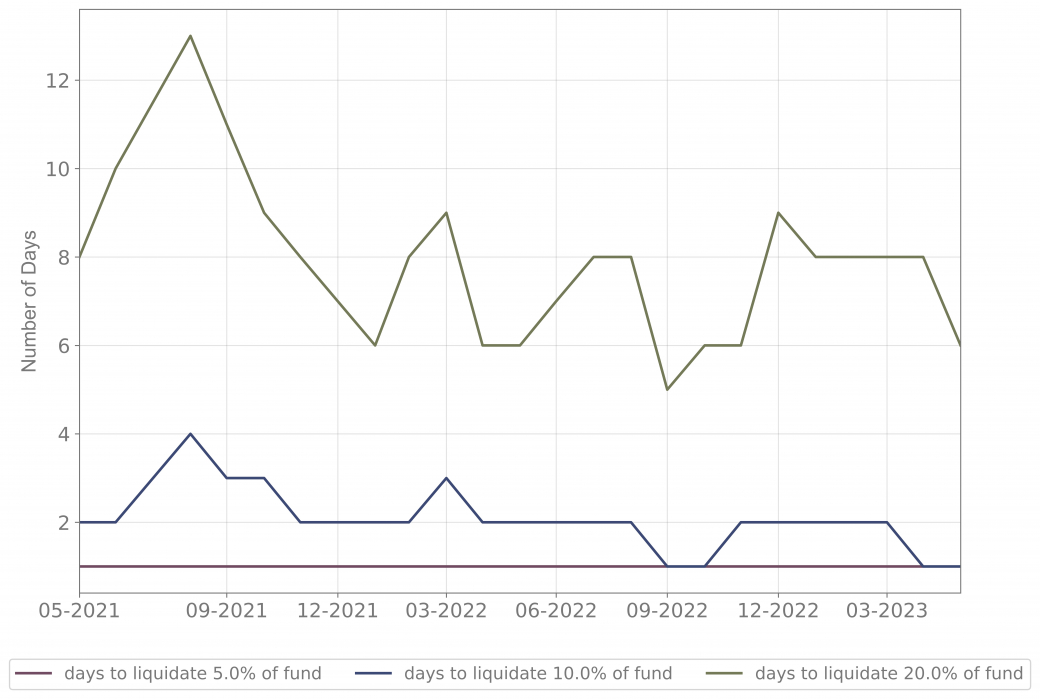
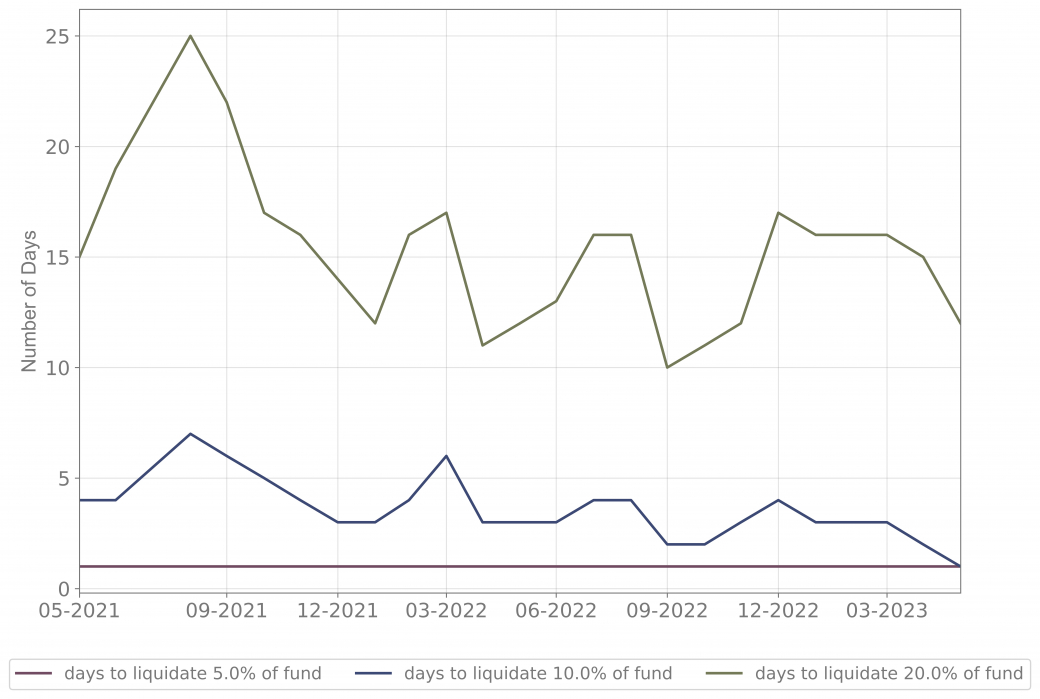
Time to liquidate x% of NAV - Tliq(x%): Number of business days it takes to liquidate x% of the fund.
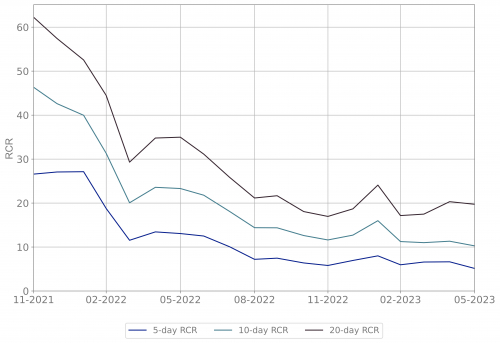
Redemption Coverage Ratio - RCR(N): The ratio between the percentage of the fund’s NAV liquidable within N days and the average redemptions over N days (net outflows) as a percentage of NAV.
Figure 3: RCR(5), RCR(10) and RCR(20) metrics over time based on a 3-month rolling average with a 15% participation rate and ADTV calculated using a 6-month rolling average.
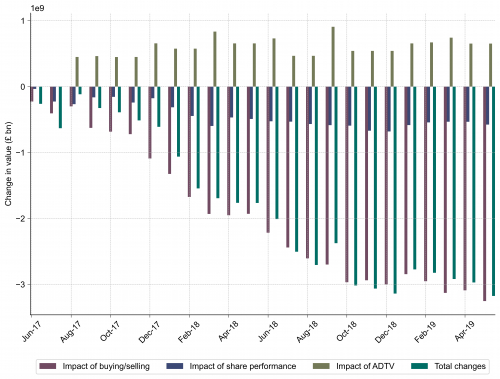
Individual component analysis: Isolates and analyses key metrics (volume, price, ADTV) to understand their impact on liquidity and bucket composition.
We employ advanced mathematical techniques to analyse the complex nature of liquidity. Our innovative approach allows us to isolate and evaluate three key components that significantly influence liquidity dynamics. These components are as follows:
By closely examining the buying and selling activities of shares, we accurately assess the impact of changes in trading volume. This enables us to gauge the effect of transactional activity on liquidity fluctuations.
Our methodology encompasses a thorough analysis of Average Daily Trading Volume (ADTV). By scrutinising the changes in ADTV, we ascertain the impact of trading patterns on liquidity, providing you with valuable insights into market dynamics.
We understand the pivotal role that price plays in determining liquidity. Through meticulous examination of price variations, we decipher how changes in asset valuation influence liquidity, offering a comprehensive understanding of market behaviour.
By precisely isolating these three distinct components, our tool generates informative plots that illustrate the cumulative impact of each factor on the change in value of the different liquidity buckets.
This analysis allows the user to pinpoint the exact root causes behind liquidity fluctuations and empowers them to make informed decisions.
Figure 4: Cumulative impact of buying/selling, share performance and ADTV on change in value of bucket 1
Stressed Liquidity Metrics
At Mazars, we understand the importance of monitoring liquidity under stressed market conditions, as outlined by regulatory guidelines. Our comprehensive suite of stressed liquidity metrics enables the user to proactively manage liquidity risks arising from various scenarios, such as market crises, increased redemptions, or asset spot shocks. Here are the different stress types we provide:
Liquidity Stress (Mid/Small Cap and Large Cap): Calibrated at the 90th percentile, these metrics assess the liquidity of mid/small cap and large cap securities based on a historical dataset spanning 10 years. This enables the user to evaluate liquidity performance under adverse market conditions, such as the European sovereign crisis.
(Historical) Redemption Stress: These metrics are calibrated based on the historical net outflows of the fund, accounting for the behaviour of institutional investors. By analysing past redemption patterns, the user can gauge the fund's resilience and liquidity adequacy during periods of increased redemptions, like the post-Brexit scenario for most UK funds.
(Hypothetical) Redemption Stress: This stress scenario focuses on hypothetical redemption patterns specifically from institutional investors. By simulating the impact of institutional investors redeeming their holdings, the user can assess the fund's liquidity under such circumstances, considering the fund's unique characteristics.
(Mixed) Redemption Stress: Combining historical redemption stress with hypothetical scenarios, these metrics provide severe yet plausible stress scenarios. By incorporating both historical trends and hypothetical redemption patterns, the user is able to gain a more comprehensive understanding of liquidity risks, possibly combined with liquidity stress factors.
(Mixed) Equity Spot Stress: This stress metric becomes relevant if the fund utilises derivatives under a Credit Support Annex (CSA) with margin call obligations. It considers adverse mark-to-market moves that may require the fund to post additional margin to the broker-dealer. This assessment ensures the user is well-prepared for potential liquidity challenges arising from equity spot shocks.
Our stressed liquidity metrics empower the user to evaluate their fund's resilience and liquidity under a range of stress scenarios.
Figure 5: Unstressed and stressed Liq(N) (top left/right) and TLiq(x%) (bottom left/right) over time with 20% participation rate and 1m ADTV.
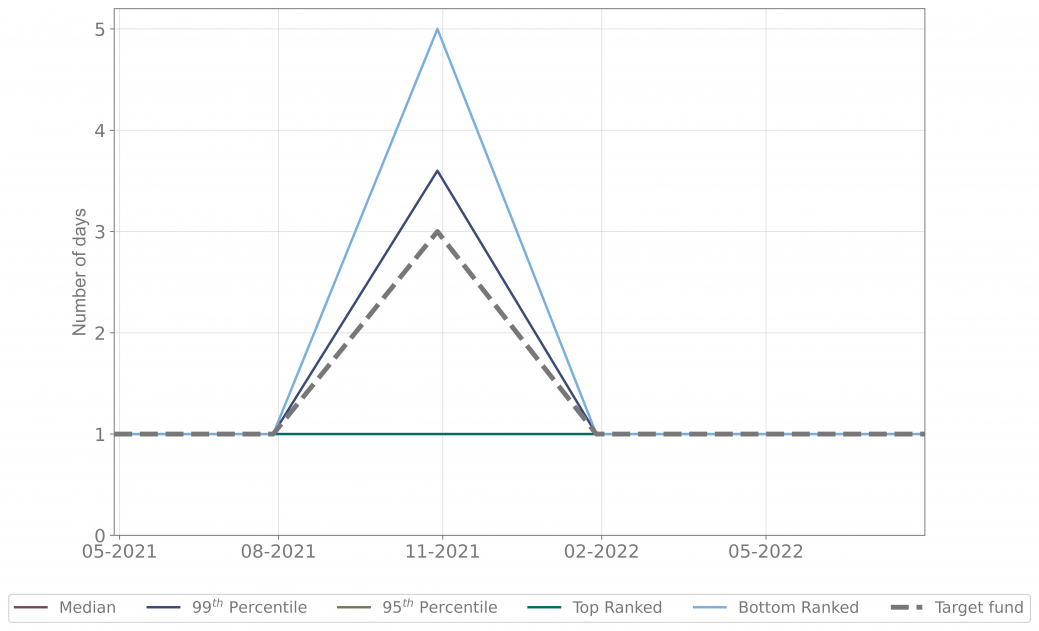
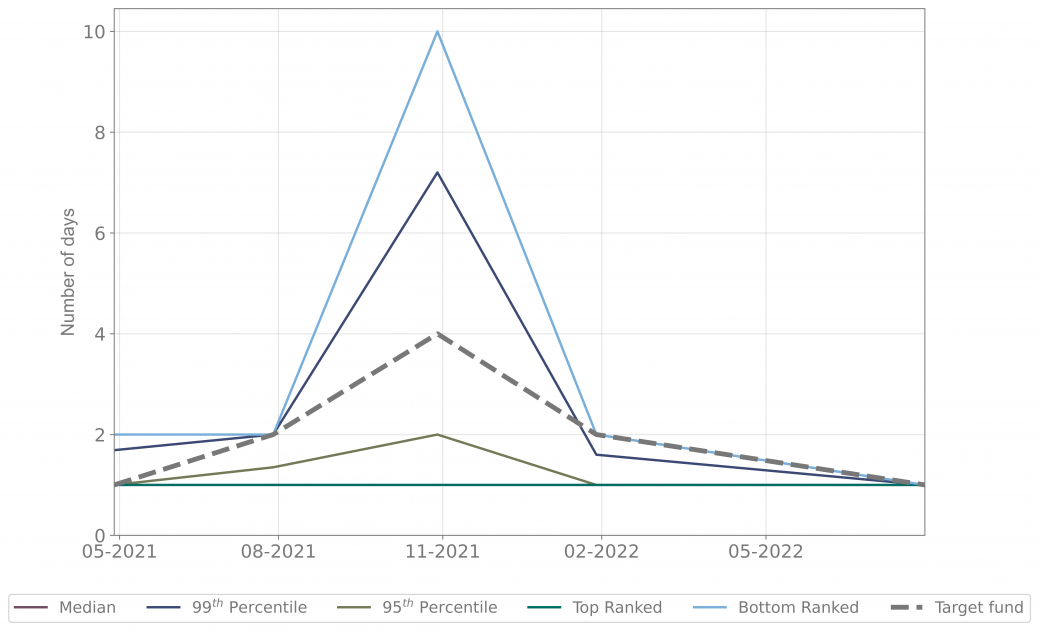
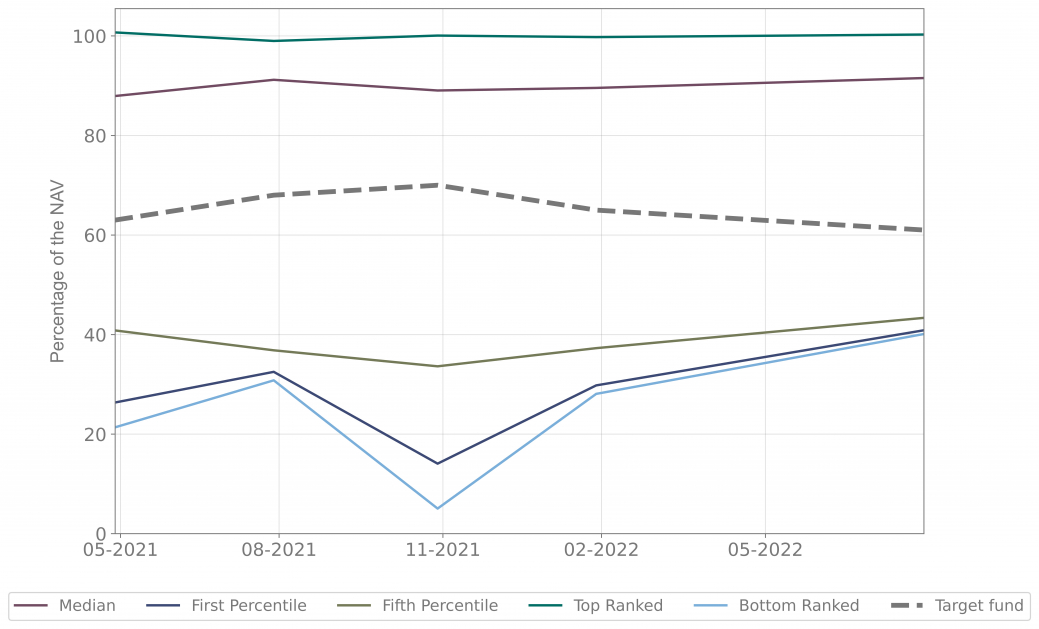
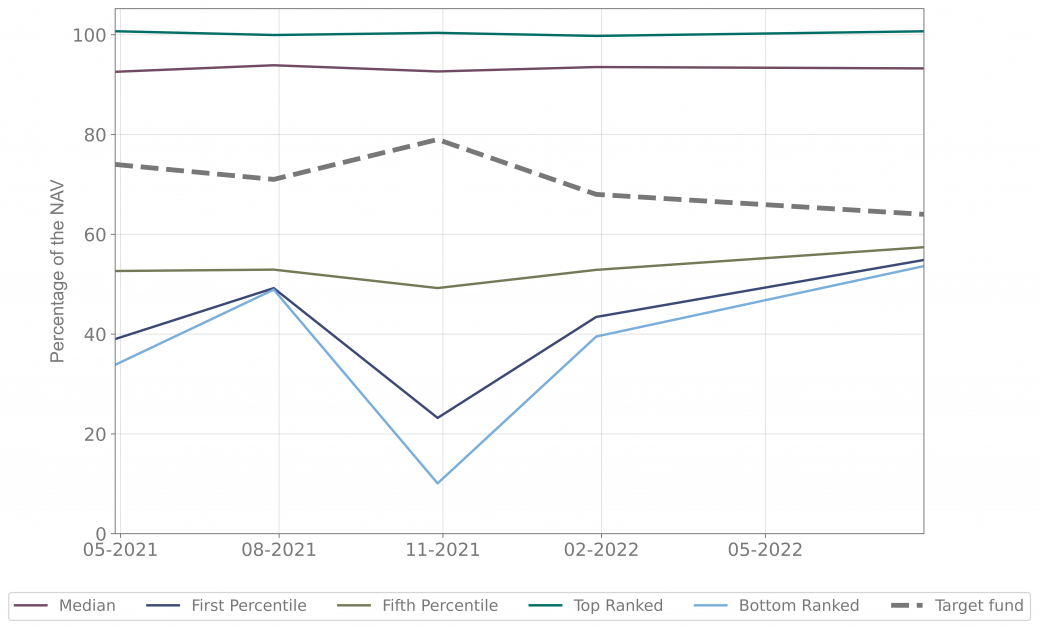
Benchmark Liquidity Metrics
A standout feature of our liquidity model is its ability to benchmark the liquidity metrics of user’s fund against those of its peers. Leveraging the comprehensive holdings data available in EIKON, our model enables the user to gain valuable insights by comparing the fund's liquidity to industry standards.
Our innovative tool affords users the valuable capability to designate a specific fund as their 'target fund' and subsequently conduct a comprehensive performance evaluation by juxtaposing said target fund against a carefully curated selection of comparative funds. These comparative funds are comprised of data from EIKON, comprising metrics that range from the median to the upper echelons, such as the 99th percentile and 95th percentile, in addition to the top and bottom-ranked funds.
Through our framework, we are able to generate all liquidity metrics described within this document for each of the comparable funds. This process allows us to establish a robust benchmark for assessing the performance of the designated target fund across a diverse spectrum of performance criteria.
The user can raise red flags and take proactive measures to optimise liquidity.
Figure 6: Top left: Liq(5) ; Top right: Liq(10)
Bottom left: Tliq(5) ; Bottom right: Tliq(10)