National contact

We have explored the BoE data and 2021 stress scenario and compared them to its 2019 scenario (given that 2020 had been cancelled) as well as the European Banking Authority’s (EBA) 2021 scenario.
All data included in this analysis is publicly available on the respective authorities’ websites.
This is the first time that Virgin Money UK have been included in the concurrent stress test. Since its merger with CYBG, it has become the sixth largest banking group in the UK, with over six million personal and business accounts, and over £90 billion in assets.
However, there is still a large gap between Virgin and the UK’s ‘big five’ high street banking groups; HSBC, Barclays, Lloyds, RBS and Santander, all of which are also included in the 2021 stress test. The smallest of the ‘big five’, Santander, has almost three times the total assets of Virgin.
While they are the smallest bank included in this year’s stress test, Virgin does hold a similar risk profile to the other banks.
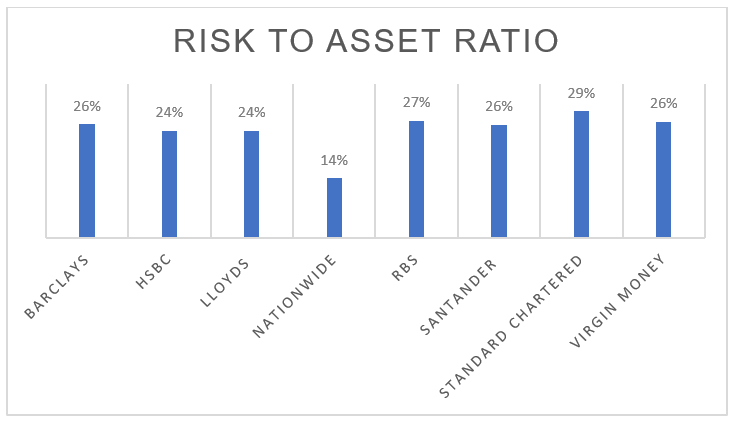
Figure 1: The ratio of Risk Weighted Assets to Total Assets (Source: 2019 Financial Reports for each bank)
The inclusion of Virgin Money isn’t the only addition the BoE have made to their stress testing framework. The BoE have added several new macroeconomic variables to increase the comprehensiveness of the stress test:
These additional variables may present challenges for more complex institutions as they will have to update their stress models.
The UK aggregate household deposit growth is perhaps the most significant change. Banks will have to account for the changes to household deposit growth, calculated as the quarterly 12-month growth rate of their M4 liabilities to the housing sector.
While the BoE have not disclosed why this metric has been included, it is likely so that they can more accurately model and assess how changes to the loan-to-value of newly written retail mortgages will impact each bank.
In previous years, the BoE simulated a stress scenario that slowly depressed the economy and after several quarters saw growth rates turn positive. In the new 2021 scenario, this is no longer the case.
The BoE had also been providing a base scenario along with each year’s stress scenario. The base scenario was used by banks to calibrate their own baseline forecasts. In 2021, the BoE have elected to not provide a base scenario as the current volatility present in the economy makes it challenging to create a meaningful forecast.
While the 2019 stress scenario was a ‘U-shaped’ stress, the 2021 version is firmly ‘V-shaped’. This means the 2021 stress scenario is a much harsher test of the participants banks’ liquidity reserves and net outflows.
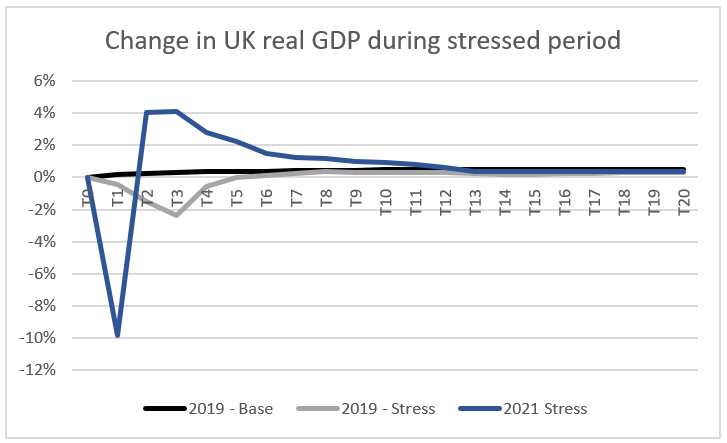
Figure 2: The percentage change in UK real GDP during each stress scenario (Source: Bank of England) where T represents a quarter
If you had to pick one word to describe the impact of the Covid-19 pandemic on financial institutions, you would be forgiven for thinking ‘severe’ was an understatement. The purpose of the BoE’s stress test is to simulate severe stress to the UK and global economy. It was never designed to simulate the type of stress that occurred in 2020 due to the pandemic.
However, when comparing key macroeconomic variables from the 2019 stress scenario with the actual 2020 figures, the 2019 scenario was, in some cases, harsher than the stress seen in 2020. Of the 52 macroeconomic variables in the 2021 scenario, 45 of these can be directly compared to the 2019 scenario and 33 of them were more severe in the 2019 stress scenario than the real figures as at Q4 2020.
As an illustration, in 2020, there was a large increase in the UK unemployment rate, which would likely have been more significant without the Coronavirus Job Retention Scheme. The current unemployment rate of 6.3% is 40% lower than the peak unemployment rate of 9.2% suggested in the 2019 scenario.
The 2021 stress scenario builds on this and simulates a similar increase in the UK unemployment rate as seen in the 2019 scenario, with a peak unemployment rate of 11.9% occurring in Q4 2021.
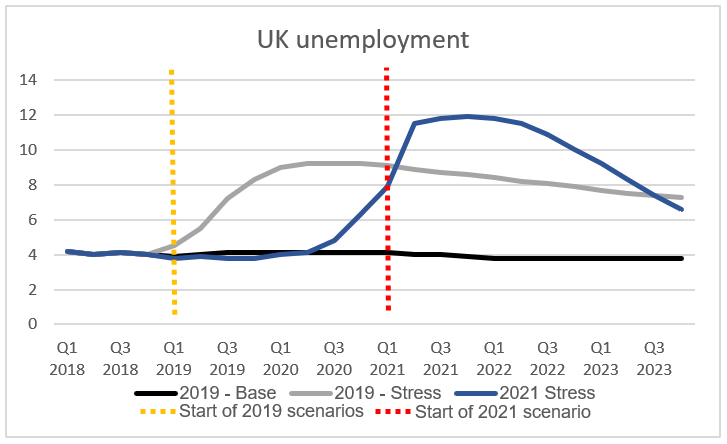
Figure 3: UK unemployment rate for each scenario (Source: Bank of England)
For all variables of the stress scenario, the BoE provide figures per quarter for 5 years. In order to model long-term changes, the BoE also provide long-term growth rates for 19 variables to be applied after 5 years.
When comparing the 2021 figures to those provided in the 2019 scenarios, 12 of the 19 variables are the same or more severe in the 2021 scenario, with the 7 that have improved relating to either Euro area GDP rates or the United States of America. The improved macroeconomic variables are:
So, while the 2019 scenario may have been more severe than what occurred in 2020, it appears that the impact of 2020 has been factored into the 2021 scenario, creating a harsher long-term scenario for UK banks.
The interest rate benchmark LIBOR is expected to cease after the end of 2021. All financial institutions must transition to alternative rates before this date. This transition has prompted the BoE to recommend SONIA benchmark as their preferred near Risk-Free Rate (RFR).
While SONIA offers a robust alternative to LIBOR, the BoE also recognise that there are several other benchmarks that UK banks may use.
The 2021 stress test is the first time that these new LIBOR-alternative rates are included. For 2021, the BoE provide stress factors for Overnight SONIA, Overnight SOFR and associate swap rates for both LIBOR-alternatives.
While the BoE simulate a ‘V-shaped’ stress scenario, the EBA have continued to simulate a ‘U-shaped’ stress.
The EBA provide yearly rates unlike the BoE’s quarterly breakdown. This means that it is more difficult for the EBA scenario to simulate a sharp contraction of the economy.
The EBA provide a base scenario which can be used to benchmark the severity of each stress against a ‘stress-free’ scenario.
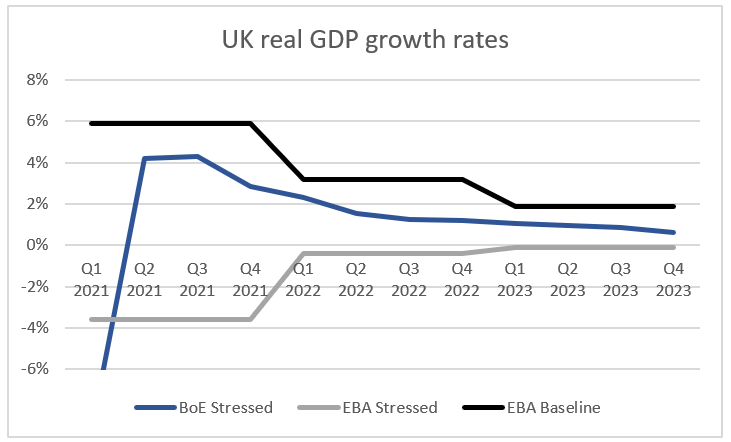
Figure 4: Quarterly UK real GDP growth rate for each scenario (Source: Bank of England and European Banking Authority)
When comparing the cumulative impact of the scenarios, the EBA scenario is more severe in the long-term with a predicted growth rate of -0.1% by the end of 2021 where the BoE provides a growth rate of 1%. The two institutions therefore have different views regarding the underlying health of the UK economy.
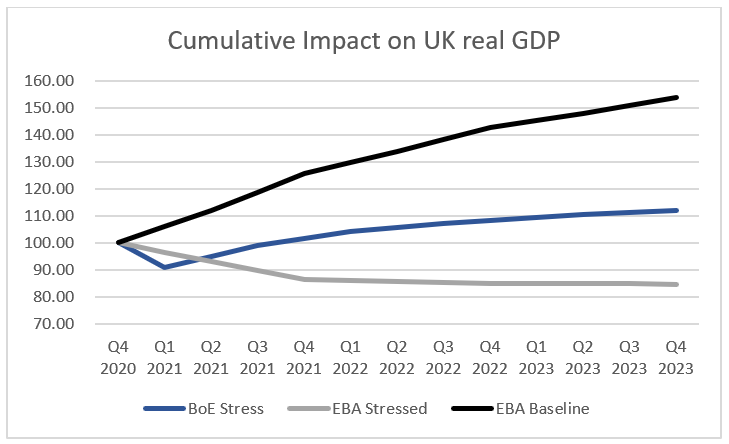
Figure 5: Cumulative impact on UK real GDP, indexed at 100 as of Q4 2020 (Source: Bank of England and European Banking Authority)
In terms of GDP, while the BoE stress scenario is more severe in the short-term, it simulates a cumulative increase of UK real GDP of 12% by the end of 2021, whereas the EBA simulate a cumulative decrease of -15%.

Expert analysis on the latest regulatory insights in the UK.
This website uses cookies.
Some of these cookies are necessary, while others help us analyse our traffic, serve advertising and deliver customised experiences for you.
For more information on the cookies we use, please refer to our Privacy Policy.
This website cannot function properly without these cookies.
Analytical cookies help us enhance our website by collecting information on its usage.
We use marketing cookies to increase the relevancy of our advertising campaigns.